Showing posts with label growth. Show all posts

Monday, April 25, 2011

How can hundreds of millions of something - anything - be scarce?


I sat next to Jim Rogers on a panel once (so you don't think I'm just making this up), and he told me that right up there with all the other unstoppable so-unbelievably-massive-you-don't-think-it's-possible changes sweeping the world is how China's gender imbalance will soon make young Chinese women among the world's rarest commodities. Yes, all hundreds of millions of young Chinese women will be relatively scarce.

[Today I read about quality on top of the quantity effect. To be clear, this is a parody of Amy Chua - so this part in brackets at least is in jest).]

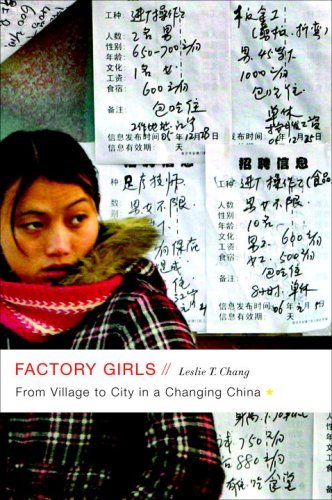
Hand in hand with this increase in the market's shadow price - economic power - will be a steep escalation in the real power of women, both personal and political. This is not to deny the harrowing experiences documented in Leslie Chang's Factory Girls but there is, at the same time, no question that there has been a dramatic upgrading of the position of women throughout Asian society, and therefore of women worldwide.

No legislation was involved. No protest movement occupied a city square. All this occurred simply through the power of economic growth, the balance between demand and supply, and the force of market equilibration. If you don't yet see this, just come take a look at the confidence, poise, and ambition of the tens of thousands of young Mainland Chinese women studying in secondary schools, junior colleges, and universities in Singapore, elsewhere in Southeast Asia, or in the West. Come take a look at LSE, for that matter.

Perhaps once again China's headlong rush for economic growth and the staggering power of markets adjusting to demand and supply in the hundreds of millions will quietly, brilliantly do what the rest of the world has found so difficult. China lifted over 600 million people out of extreme poverty over the last quarter of a century, when no one else was looking - and therefore when no one was giving China foreign aid or telling it how to run its schools.

This time, for elevating yet another disadvantaged community will China, once again, quietly using just growth and markets achieve more than all other efforts micro-managing around the edges of global poverty?

PS Many readers, of course, quickly link in their mind this gender imbalance to the many horrific tales one hears emerging from China's one-child policy. If 119 boys are born for every 100 girls - as usually reported for China - then that works out to 840 girls to 1000 boys. Given China's population of 1.3 billion, this means 24 million Chinese men of marrying age without spouses by 2020.

It is instructive if grim to note this gender bias is seen as well in the very differently-governed India where the 0-6 age group now has 914 girls to 1000 boys (down from 927/1000 in 2001), confirming how the country has become "a terrifyingly hostile place to be conceived or born a girl", pointed out to me by Vinayak @kayaniv.

Friday, July 17, 2009

Time to save the world economy through the sheer weight of numbers

Reuters reported yesterday (Thursday 16 July 2009) that with China's economic activity picking up in 2009Q2, the Chinese full-year 8% growth target might now be achievable.

Will China save the world?

No one can yet be sure how these latest developments will play out. Of course, upon hearing good news of this kind, nay-sayers are quick to relate how a more pessimistic picture is indicated by other numbers. [Power consumption is usually a good fallback for this - although it's not clear to me which fully fleshed-out economic theory says why that is so.]

Or some say that the good news is likely just unsustainable short-term hot money channeling into propping up only temporarily asset markets and bank lending. [Come to think of it, except for long-term trend growth, doesn't every kind of aggregate demand expansion simply prop up asset markets in the short run? And isn't increasing bank lending exactly what we're trying to do elsewhere in the world? Unsuccessfully at that? At the end of it all, any action that releases 4 trillion units of anything - such as that China has undertaken with its fiscal expansion - has got to have some slippage.]

Finally, there's that portmanteau standby: "I just don't trust these numbers," instantly killing all intellectual debate. That one never grows old.

Perhaps the ambiguity in the current numbers is genuine. So look elsewhere: a historical perspective might be useful.

The 1997 Asian Currency Crisis was, up through 2008, perhaps yet the most wrenching financial and economic crisis in East and Southeast (ESE) Asia. In its concentrated impact on the region, 1997 might well have been just as severe as 2008/2009 for ESE Asia. From June 1997 to mid-January 1998 exchange rates against the US dollar of the currencies of Indonesia, South Korea, Malaysia, the Philippines, and Thailand fell by over 50%; that of Singapore, 20%. In Japan and in every single one of these economies, GDP growth turned negative in 1998, with the combined fall in these economies' 1998 GDP amounting to 2.4% of GDP in ESE Asia the preceding year. Millions of people lost their jobs.

So, if you had been following developments in fast-growing ESE Asia up through before 1997, were then shocked by 1997's sweep through the region, what should you have expected for how wrenching these losses were and how much they perturbed that region's growth path? Here's a graph of the fitted trend line through 1996 of GDP in ESE Asia (excluding Japan), then projected forwards and compared to reality post-1997:


The striking feature in this chart is how little a change in the growth path resulted from what at that time was viewed to be a dramatic downturn. Sure, the accumulated GDP under-performance from 1997 to 2006 was 5.1%. But the same calculation for the world economy overall was 11%, more than double that for ESE Asia, although the world's pre-1996 growth rate was only 3.7% a year in contrast with ESE Asia's 7.6%. Even before the 2008 global financial crisis, the world overall had slowed in comparison to the 4 decades before 1997. But ESE Asia, the centre of that period's financial crisis, emerged far better than one might have expected then.

Or did it? If we exclude not just Japan but also China from ESE Asia, the graph that emerges is quite striking and a little scary:

the accumulated under-performance is then 21%! Through sheer size and economic performance, the significance of China should have been observable even from outer space. This importance of China in aggregate economic performance mirrors its single-handed reduction of the world's poverty over the last three decades (that I've blogged on previously).

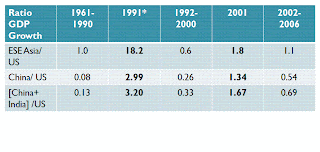
To emphasize further this historical point, recall that prior to 2008 the last two times the US economy went into recession was 1991 and 2001: in 1991 US GDP fell $13.7 bn. In 2001 US GDP grew US$74.1 bn. By contrast, ESE Asia generally and China in particular continued to grow throughout. Taking absolute values, and comparing these changes with those elsewhere gives this table:

All data here are in constant 2005 US dollars, evaluated at market exchange rates, not purchasing power parity - so the denomination in this comparison is what the whole world would use to buy wide-body Boeing jets, Nokia cellphones, and Italian fashion design.

True, in this comparison, China's per capita income now stands at only 1/14th that of the US; in aggregate, the US economy is still one quarter that of the entire world. But even so and even over relatively long stretches of time (2002-2006) China was already contributing more than half of the growth to the world economy that the US was doing. In times of US and world downturns, however, that ratio rises dramatically: China contributed 3 times what the US failed to do in 1991 (again, using the absolute value of the US change in income), nearly one and a half times the US's contribution in 2001.

Indeed, the rise of China [and to a smaller extent India] since the early 1980s has shifted the world's economic center of gravity 1800 km - 1/3 of the planet's radius - deeper into the Earth's crust, away from the US, and towards the East (previously blogged). This transition accelerated in 1991 and 2001, each time the US was in recession.

So, perhaps this time, it won't surprise that China leads the world economy out of recession. After all, it's already done so before, quietly.

Notes: I met John Ross recently, when he and I spoke on a panel on London and the global economic crisis, but hadn't seen his recent post on China's dramatically shrinking trade surplus, making a similar and more current point than my own post here. I highly recommend his posting.

All data are from the World Bank's World Development Indicators 2008. I provide more details on the numbers I've described above in my paper, "Post 1990s East Asian economic growth" (October 2008; also Spanish translation in pp. 40-52, Claves de la Economia Mundial 2009, Instituto Espanol de Comercio Exterior, Secretaria de Estado de Comercio, Ministerio de Industria, Espana www.icex.es).

Thursday, May 28, 2009

One quick look at the world's shifting economic centre of gravity

With constant twitter and Facebook updates, I find myself putting off blogging anything altogether. Many items that might have appeared here have gone there instead. But then this entry doesn't really go in 140 characters.

At Hay Festival last weekend I appeared together with Howard Davies on a panel discussing the global economic crisis. For that and for some work (teaching, writing) that I'm doing on the global economy, I prepared this animation:


(A somewhat fuller-sized animation appears on my econ.lse site... but then we are talking about the world, so, despite the best efforts of Google Earth, anything on a computer screen will always be a little too small and representational.)

Obviously, a few more things need still to be thought through on this but for now the flat-world map animates the shift in the world's economic centre of gravity (building on calculations by Jean-Marie Grether and Nicole Mathys). The rise of China and India since the early 1980s has shifted the world's economic center of gravity 1800 km - 1/3 of the planet's radius - deeper into the Earth's crust, away from the US, and towards the East. The transition accelerated in 1991 and 2001, each time the US was in recession.

It might seem peculiar that the world's economic centre of gravity is so far north - is there some massive production going on near the North Pole that the world's military haven't told us about? No, that feature comes instead from how the 2-dimensional flat map has to represent something going on in a 3-dimensional spherical Earth. Suppose, for illustration, that Earth has two roughly equal centres of production at the same latitude just north of the equator but on the same great circle. Their centre of gravity is at that same latitude but deep within the Earth. Then, when you project a straight line from the Earth's centre to that centre of gravity and keep going until you burst out of Earth's surface, you come out quite far north - certainly further north than those two production centres were to begin. So, as long as most of Earth's production occurs in the Northern Hemisphere and aren't all closely located to each other so that only one side dominates, projection onto a 2-dimensional flatmap always shows the centre of gravity on the Earth's surface appearing quite far north.

Although it's not, strictly speaking, an error, I do think some re-definition of concepts would be useful. That's something I'm trying to fix now.

PS I've already referred to my paper on post-1990s East Asian economic growth elsewhere on this blog but, yes, that article contains more detail on the effects described in the animation.

Saturday, November 15, 2008

Martial arts on the mean streets of East Asia

In his book Angry White Pyjamas Robert Twigger, the prize-winning poet and author, and martial artist, describes how in the 1930s Gozo Shioda would prowl the streets of Kabuki-cho Tokyo, looking to fight street gangs and test his martial arts skills.

Decades after, Gozo Shioda went on to establish the Yoshinkan style of aikido.  In the eyes of some, Shioda and his teacher Morihei Ueshiba were at one point Japan’s greatest martial artists.

Ueshiba used to tell his students “On no account go looking for fights.”  Shioda, like many other good martial arts students, completely ignored his teacher on this.  

Instead, out of the situations in which Shioda constantly found himself, he formulated his own rules, like “In a fight against many, always make the first blow count against the strongest man.”

Shioda felt that you only really understand what aikido is when you have to use it in life-or-death situations.  His own aikido-enlightenment moment came when, cornered by four gang members, he used aikido techniques to break the arm of one of his attackers and the leg of another, and incapacitated a third by a single punch to the solar plexus.  According to Shioda's autobiography he appreciated only then how aikido wasn’t something you just practiced in a safe environment.

I have friends who train in aikido but I myself do taekwon-do, the birthplace of which is Korea.  So, that balmy July evening in Seoul when my taekwon-do training partner James and I came out of his dojang, we reminded one another of what Ueshiba and Shioda would have said, had they been walking Seoul’s crowded streets alongside us.  James, who has started training seriously in hapki-do as well, pointed out to me how in modern Korean language you say taekwon-do players but hapki-do fighters.

Every street corner in Seoul has over a dozen schools of taekwon-do and hapki-do.  Every shaded doorway has darkened stairwells leading up to a brightly-lit dojang.  Martial arts training is everywhere.

The other thing found everywhere in Seoul is free WiFi.  When you land in most airports in the world, service providers try to sell you a pay-as-you-go SIM card so you can use your cellphone without incurring high roaming charges.  At Incheon and Gimpo, they try to get you to rent a Skype handset instead.  Why call over cellular networks when you can just log in to the Internet on a cellphone handset, and transmit via VOIP for zero marginal cost?

I think that is truly cool.  It just makes so much sense.

South Korea’s 15-year-olds score highest in the world at problem-solving skills, way ahead of the US, the UK, France, or Germany, in the OECD’s 2006 Program for International Student Assessment Surveys.  Fifteen-year-olds in Hong Kong and Japan score well up there too, right alongside South Korea, and again far, far above the US, the UK, France, and Germany.  The same pattern emerges again for science skills and mathematics skills.

South Korea is a country brimming with clever people, knowledge, and technology, of the most exciting, intelligent, and useful kind.  The same holds for Hong Kong, Japan, and Singapore.  [Singapore will only start to participate in PISA surveys from 2009, and so its formidable student strength in mathematics, science, and problem-solving—apparent to anyone who teaches undergraduate students at any good international university— will only appear in the next OECD round.]

When economists estimate TFP (total factor productivity) to be low for countries such as these, whatever it is that we’re measuring more and more accurately as TFP, it simply can't be technology—at least, not the way technology is commonly understood.  So what is it that we have ended up estimating better and better?

Oh, back in Seoul, James and I felt that before anything else happened that hot July evening we needed sustenance.  So, taekwon-do player and hapki-do fighter together, we went and had really good Tak Galbi for dinner.  I described to James how in February 2005, after giving a talk on the global economy to Rusal executives in Moscow, I was jumped by 3 men while I was wandering about Red Square in the early evening.  I had then nowhere near Shioda’s presence of mind.  The month after that, I broke my nose fighting in a tournament. But I didn’t consider I had yet had a Shioda moment, and I was just as glad not.

So, after dinner, as all good martial arts students eventually must, I followed Gozo Shioda's example and I broke the law.  I bought a Kung Fu Panda DVD off a street vendor.  All the while, however, I was thinking about the relative sizes of deadweight loss and ex ante incentives in this picture of monopoly pricing under intellectual property rights.

When I got to Kuala Lumpur in late July, I discovered that Sri Hartamas too has dozens of martial arts schools.  So, August there, I trained with several seriously dangerous-looking hapki-do practitioners at Grandmaster Lim’s dojang in Mt Kiara.  (Thanks to my taekwon-do teacher at LSE Kian-lun Wong for making introductions.  Kian-lun and our LSE taekwon-do club are affiliated with Grandmaster Lim's Korean Martial Arts organization in Malaysia.)


In this same time I presented papers in Singapore and Seoul; made speeches to LSE alumni in Tokyo, Kuala Lumpur, and Singapore; gave lectures at Bank Negara Malaysia and Khazanah Nasional in Kuala Lumpur; and discussed economics and government policy in Ministerial offices and with numerous panellists on radio and TV throughout Southeast Asia (including the first ever webcam telecast for RTM on 29 August 2008).  I am grateful to Governor Zeti at Bank Negara Malaysia, Chairman Zarinah at Securities Commission Malaysia, Minister Shahrir Samad, Tan Sri Dr Munir Majid, Tan Sri Azman Mokhtar, Malaysia’s Finance Minister Nor Mohamed Yakcop, Singapore’s Finance Minister Tharman Shanmugaratnam, Takatoshi Ito, Bart Thia, Khuong-minh Vu, Dato' Azman Yahya, Dato' Dr R. Thillainathan, Carmen Chua, and many others who gave generously of their time to talk to me about the economics of the region wherever I went.


Papers I’ve written recently relevant to the preceding discussion include:

Post-1990s East Asian Economic Growth (October 2008)

Knowledge:  The driver of economic growth (June 2008)


while lectures and presentations include:


Khazanah Megatrends Forum (October 2008, KL: "Shifting sands:  The real side longer term")

Bank Negara Malaysia lecture (August 2008, KL: "Global growth and inflation")

LSE Tokyo alumni lecture (July 2008, Tokyo: "Post-1990s East Asian economic growth") [Photos]

LSE Malaysian alumni lecture (May 2008, KL: "The rise and fall of subsidies") [Ng Wei-Li's photos]

LSE Asia Forum in Singapore (April 2008, Singapore: "Knowledge: The driver of economic growth") [video]


[The aikido photograph is of my friend Attila Emam, who is third-dan blackbelt in aikido (and LSE-trained economist now at Securities Commission Malaysia), executing a throw.  The taekwon-do photograph, from September 2007, shows me sparring my instructor Mr Read, who is fifth-dan blackbelt in taekwon-do:  I am executing a jump spinning back kick while he is preparing to deliver a hook kick at my head.  The photograph is a still that I extracted from a video of us sparring.  The 2008 May photograph is of a meeting with Finance Minister Nor Mohamed Yakcop in his Putrajaya office.  The 2008 July photograph is from the LSE Tokyo alumni event at the Roppongi Hills Club.  The 2008 August photograph was taken after my lecture at Bank Negara Malaysia.  I obviously wear Vivienne Westwood way too often.]


Sunday, April 06, 2008

Who moved my BlackBerry... and those hundreds of millions of people?

China and India are, for now, the only billion-people economies. In one popular telling, China shifted hundreds of millions of workers from farms to urban areas. In that story that switch rate, paired with reasonable assumptions on relative productivities in relatively backwards agriculture and forward-looking manufacturing just about matches China's overall growth rate, after factoring in other measureable progress.

A related not uncommon view further has it that India codes workman-like software, designs lower-end pharmaceuticals, answers queries about insurance claims over the telephone, and scans X-rays that Western doctors are too busy to do. These jobs might pay far less than done in the West but, in their part of the global marketplace, they almost surely pay better than stitching together textiles in Shanghai () or assembling refrigerators in Shandong Peninsula (山东半岛).

So, which economy has had its growth driven more by changes in labour input? Where have more people moved out of poverty?


The Figures (using data kindly provided me by Dale Jorgensen and Khuong-minh Vu that they had used in their paper "Information Technology and the World Economy", 2006) show decompositions of Chinese and Indian growth into contributions due to physical capital, labour, and productivity (TFP). Earlier on, between 1989 and 1995, China certainly drew more on labour than did India to power economic growth and, true to stereotype, drew more on labour hours ("mere sweat and effort") than on labour quality, i.e., on skills and human capital. But even then the difference was small.

By 2000-2005 the most recent period for which we have data, China had come to rely more on physical capital, i.e., on machines. Its reliance on labour had fallen to 13%, almost exactly half that of India's. That shift occurred, moreover, with little loss in productivity's contribution. Through both periods and in both countries, productivity never contributed less than 40% of growth overall.

By 2000-2005, in fact, China's profile of growth contribution from capital, labour, and productivity almost exactly matched that of the US. The difference, of course, is that China has been growing at 3 times the rate of the US.


The next Figure (per capita income on the horizontal axis; hundreds of millions in $1/day-poverty) shows how China's much, much more impressive aggregate growth has lifted half a billion people out of extreme poverty in the last quarter-century; India, on the other hand, has only recently and, by comparison, imperceptibly started along the same path. But with a long way to go still. The data are for 1984-2004; I had used them in a previous blog posting.


My own small contribution on global inequality the last couple months was extremely practical. I did what I could in charitable fundraising. The video shows my friend Maria Gratsova holding the board for an airbreak. I performed a jump spinning hook kick. This particular event was the LSE Development Society auction on 05 February 2008, and I was up on the auction block. Fortunately, someone did buy me - for much more than I'm worth. But the money went to a good cause and the deal was that we had a paid-for dinner together afterwards.

(Yes, yes, I know, boards don't hit back but an airbreak means the board swings loose, and so is harder to break. And of course that they don't hit back doesn't mean they break everytime. In this next video [from September 2007] I attempted two boards on one jump and only broke one.)


Thanks to the kindness of friends, Maria and I held a repeat performance at LSE's Malaysia-Singapore Students Night, 23 February 2008, in the Old Theatre. Money changed hands there too, and for just as worthy a cause. (This still is from LiEe Ng's camera; thanks LiEe!)

Saturday, September 01, 2007

Global balance and equality

In August 2007 I was part of the opening keynote panel discussion at the Singapore Economic Review Conference (and got to have lunch with LSE alumni and friends in Singapore).

I wanted to show the large forces that drive global inequality and poverty, those changes that affect, in one fell swoop, the quality of life for many of the 6.3 billion people on earth.

I have two candidates for massive worldwide change: First, economic growth; second, China. The graphic illustrates both.


(a larger dynamic animation can be invoked if the inline version above isn't clear enough in your browser; or just click anywhere in the figure).

The vertical axis measures millions of people living on less than 1 US dollar a day (actually, the threshold is 1 International Dollar a day, but close enough). The horizontal axis is per capita income in the country or bloc of countries: Economic growth means movement rightwards horizontally. The size of a bubble measures the total population. EAP indicates East Asia and the Pacific Region; LAC, Latin America and the Caribbean; MENA, Middle East and North Africa; SAS, South Asia; and SSA, Sub-Saharan Africa. Additionally, China and India are given separately in the graphic.

The animation follows these continental groupings over time, from 1990 through 2004, and shows how as growth occurs, poverty falls.

In principle, if inequality within a continent or within China or India increased sufficiently with economic growth, then the corresponding bubble in the picture might well rise vertically. All that means then is that, in that case, even though average income increases with growth, inequality increases so overwhelmingly that the joint growth-inequality process grinds ever more people into ever greater bone-crunching poverty.

(To be clear, inequality does not have to increase with economic growth. But many people and quite a few economists think it might---hence the so-called tradeoff between equality and efficiency. The data do not speak very strongly on this, in either direction. But I think such a putative regularity is of little consequence for the point here.)

Almost uniformly, the graphic shows inequality is unable to rise enough to overcome the benefits of economic growth. As a matter of logic alone, of course, it might: an actual, large instance in the animation is China between 1996 and 1999: In that 3-year period the China bubble moved rightwards and upwards. So there's nothing in the arithmetic that rules out the possibility. But it is unusual. As time proceeds, almost uniformly, the bubbles move southeasterly, shifting rightwards and dropping towards the floor. This is a very good thing. Economic growth reduces poverty.

In the animation, right at the start of the sample Eastern Europe and Central Asia (ECA) implodes leftwards, just as post-Communist transition began. But then after that pretty much only the rightwards movement is visible. Compared to China, that other 1-billion people economy India, up through 2004, still hadn't done very much. Sub-Saharan Africa (SSA) all this time basically did nothing but percolate upwards: It didn't grow and it saw vast numbers of its people fall ever further into grinding poverty.

In 1981 1.47 billion people on earth lived on less than 1 dollar a day. By 2004 that number had fallen to 0.97 billion, a reduction of half a billion. (If you don't like these numbers, you come up with better ones. In economic research it takes a model to beat a model, so simply complaining that a model isn't a good model or is unrealistic doesn't get you very far. So too whining that an estimate isn't a good estimate.) The animation shows that pretty much all of that worldwide poverty reduction is due to just ... China.

Since this animation, like all digital goods, is infinitely expansible, I also presented it at a British-Malaysia Chamber of Commerce lunch and as part of a lecture at the British Council in Malaysia, both also in August, as part of Malaysia's 50th anniversary celebration of its independence from Britain. (The animation is also on youtube and you can put a version on your cellphone if you like.)

The underlying data are from Chen and Ravallion (2007) "Absolute Poverty Measures for the Developing World" and from World Development Indicators (2006) online. Further analysis is in Quah (2007) "Life in Unequal Growing Economies". Related discussion appears in Quah (2003) "One Third of the World's Growth and Inequality".

I generated the animation by

latex 2007.08-SERC-lug-dq.tex
dvips -pp 5-10 -o - 2007.08-SERC-lug-dq.dvi | ps2pdf - - | convert -delay 80 - 1-2007.08-SERC-lug-dq.gif

i.e., using standard tools latex, dvips, ps2pdf, and convert.